In this post, I describe how graph theory popped up out of the blue in a real project.
In one of the latest posts I described near-duplicate detection with LSH and how to run it in Python with Datasketch.
When you apply it to scientific papers or submitted manuscripts, you can spot various types of fraudulent behavior:
- simultaneous submissions – when the authors send 2 or more manuscripts to the different journals at the same time;
- duplicate publications – cases when there is a pair of almost identical published papers
- “salami slicing” – when a long paper is split into several smaller ones, each published independently;
- “paper mills” – research misconduct of selling fraudulent papers, some of those can be spotted with near-dup detection algorithms.
Example of a spotted potential retraction.
With my prototype, we first developed a near-duplicate detection solution at Elsevier and then collaborated with STM to roll it out for all publishers.
Internally, at Elsevier, we measured that around 4% of manuscripts have a near-duplicate submitted earlier. Prior to scaling the algorithm to all journals by all major publishers, a reasonable question we asked was: As we increase the set of papers under consideration, how does the percentage of those having at least one near-duplicate change? Apparently, if we’d expect it to stay at 4% that’s one story, but if we expect to have 20% of near-dups, that’s a completely different story.
Mathematical problem formulation
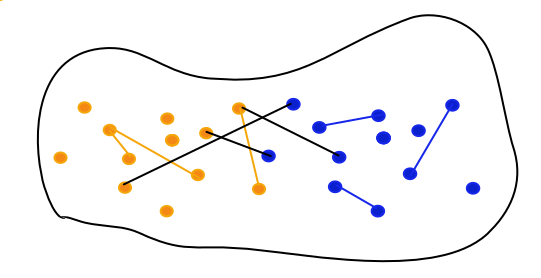
Let a graph represent the relation “to be a near-duplicate”
\(N\) – is the number of nodes, \(E\) – is the number of edges.
Interpretation:
- node \(\leftrightarrow\) a title/abstract/full text of a manuscript/paper
- edge \(\leftrightarrow\) 2 titles/abstracts/full texts are near-duplicates
- connected node (with at least one edge) \(\leftrightarrow\) a title/abstract/full text has at least one near-duplicate
- isolated node (without edges) \(\leftrightarrow\) a title/abstract/full text is “unique”
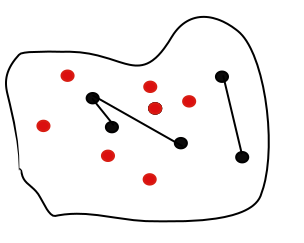
Let’s say Publisher 1 ran LSH and found \(\Large \alpha_1\) % of near-dups (connected nodes):
Now, Publisher 2 also ran LSH and found \(\Large \alpha_2\) % of near-dups (connected nodes):
Question: What’s the new \(\Large \alpha\) % of connected nodes in the combined graph?
Note:
- we are unlikely to ever check this experimentally;
- we are unlikely to estimate the share of edges between the 2 sets (near-dups across Publisher 1 and Publisher 2) as the parties do not share data.
Looking from another perspective:
- What’s the % of isolated nodes (“unique” papers) in a graph?
- How does this % grow in a growing graph?
Assumptions
We assume a random graph model:
- each pair of nodes is connected by an edge with a fixed probability \(\large \mathbb{p} \ll 1\)
- the fact that two nodes are connected is independent of other nodes/edges
- \(\large \mathbb{p}\) is independent of the number of nodes
“All models are wrong but some are useful”
George Box, British statistician
Deriving the formula for # isolated nodes
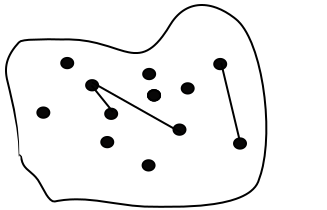
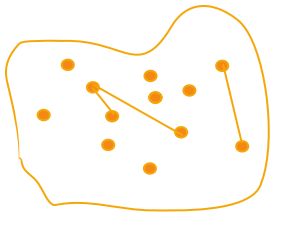
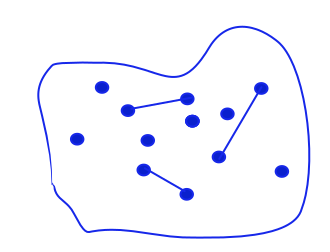
Let’s consider a graph with \(n-1\) nodes (black), and separately, the \(n\)-th node (green) which is “added” to the graph.
Interpretation: a growing set of papers.
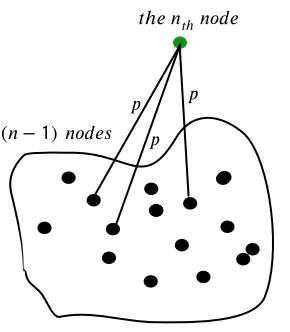
The \(n\)-th node is connected to each one of the other nodes with a fixed probability \(\large \mathbb{p} \ll 1\).
The probability that it’s not connected to any of them (i.e. isolated):
\[\large P_{iso} = {(1-\mathbb{p})}^{(n-1)}\]With \(\large \mathbb{p} \ll 1\) and \(\large n \gg 1\) we have:
\[P_{iso} = {(1-\mathbb{p})}^{(n-1)} \approx {(1-\mathbb{p})}^n = \sum_{k=1}^n {n \choose k} (-\mathbb{p})^k\] \[= 1 - n\mathbb{p} + \frac{n(n-1)}{2}\mathbb{p}^2 - \frac{n(n-1)(n-2)}{6}\mathbb{p}^3 + \dots\] \[\approx 1 - n\mathbb{p} + \frac{n^2}{2}\mathbb{p}^2 - \frac{n^3}{6}\mathbb{p}^3 + \dots\] $$\Large = e^{-n\mathbb{p}}$$We arrived to an exponential dependency of \(P_{iso}\) on \(n\).
\(P_{iso}\) is also the expected percentage of isolated nodes in the graph.
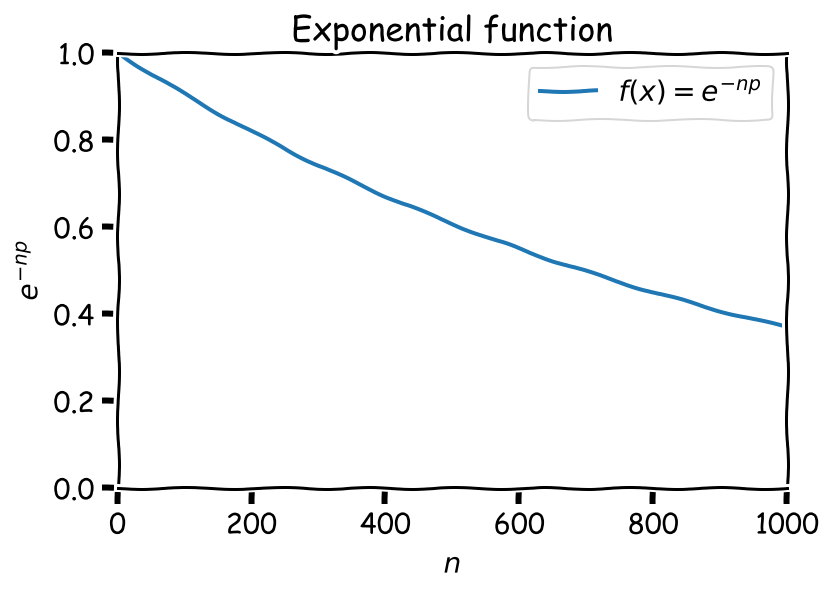
Interpretation: as the set of papers is growing, there’s a higher chance that any of the papers will see a near-duplicate, and thus the percentage of “unique” papers is dropping.
Experimental results
700k ScienceDirect abstracts
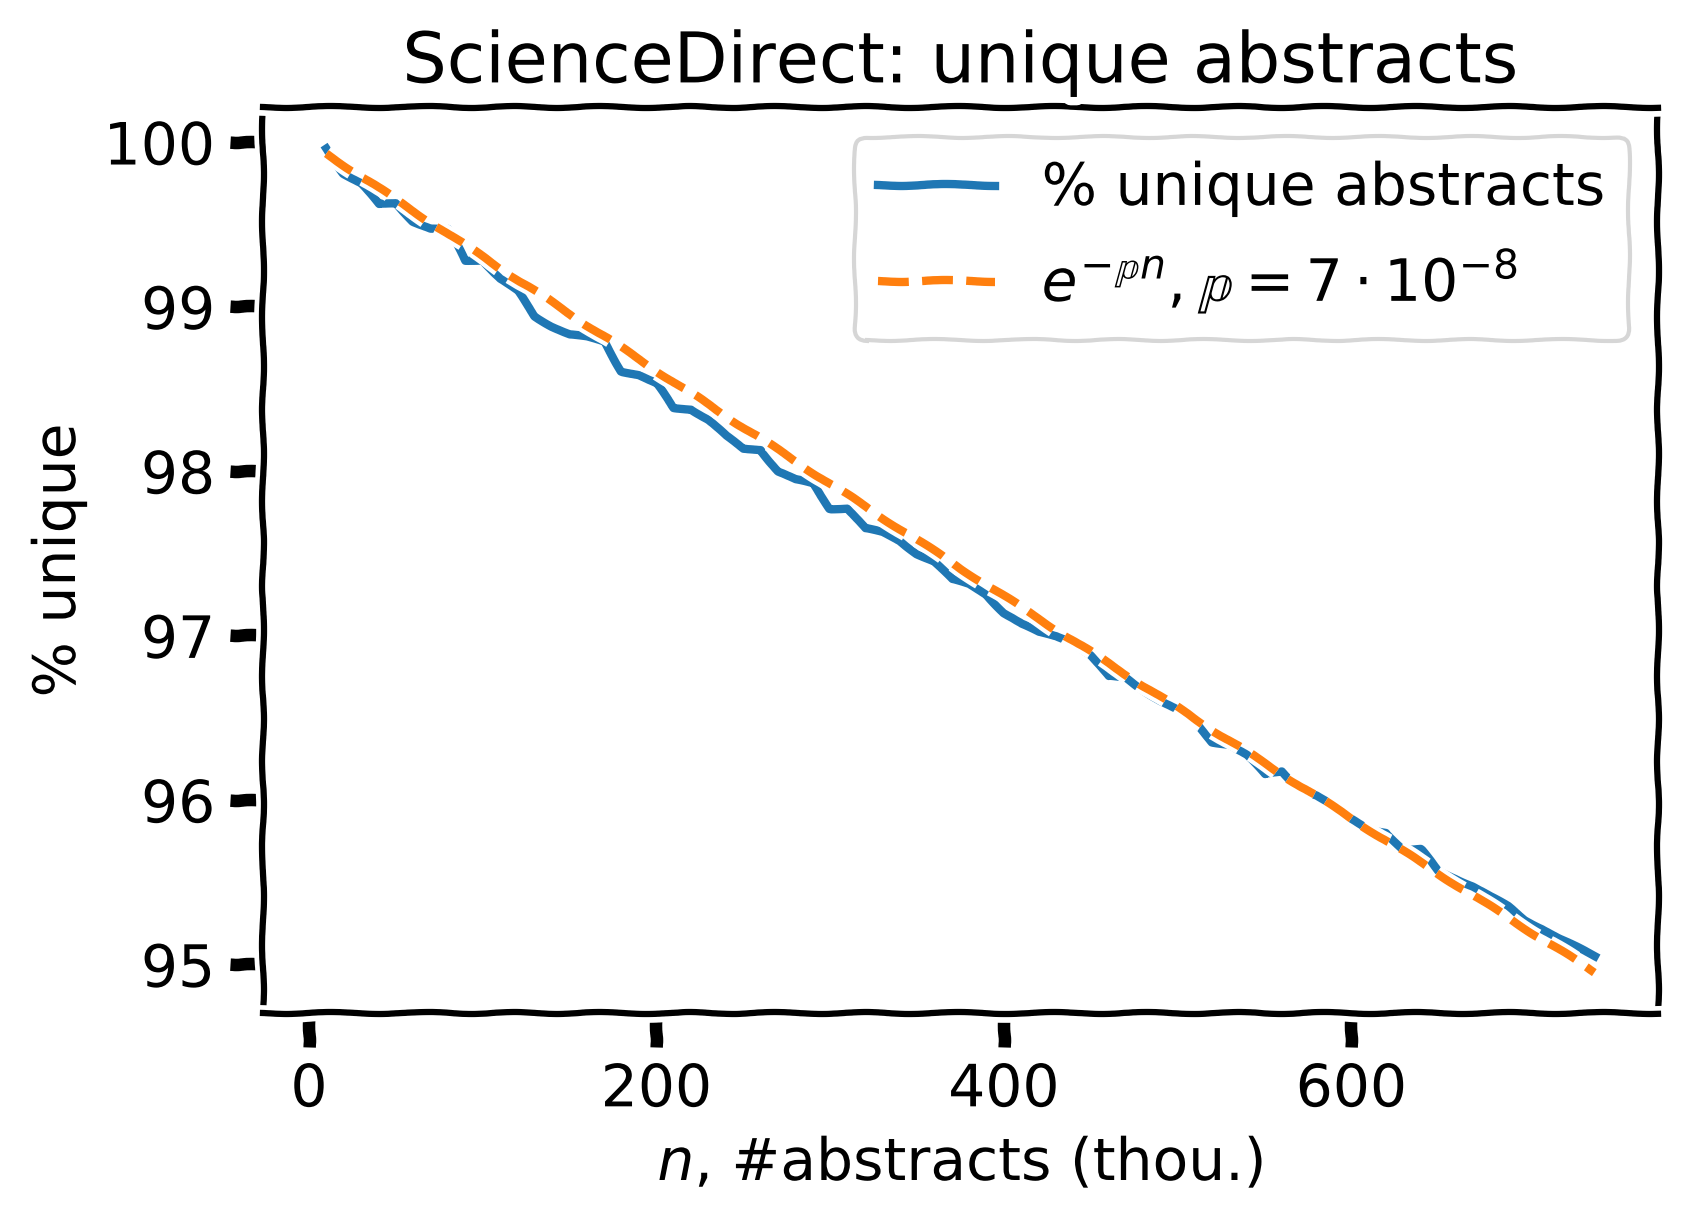
Percent of unique abstracts (blue) and the corresponding prediction (orange).
For 700k ScienceDirect abstracts, we see ~95% of unique ones, 5% have \(\geq1\) near-duplicate.
Estimated \(\large \mathbb{p} = 7 \cdot 10^{-8}\)
Same + projected to 10 mln. papers
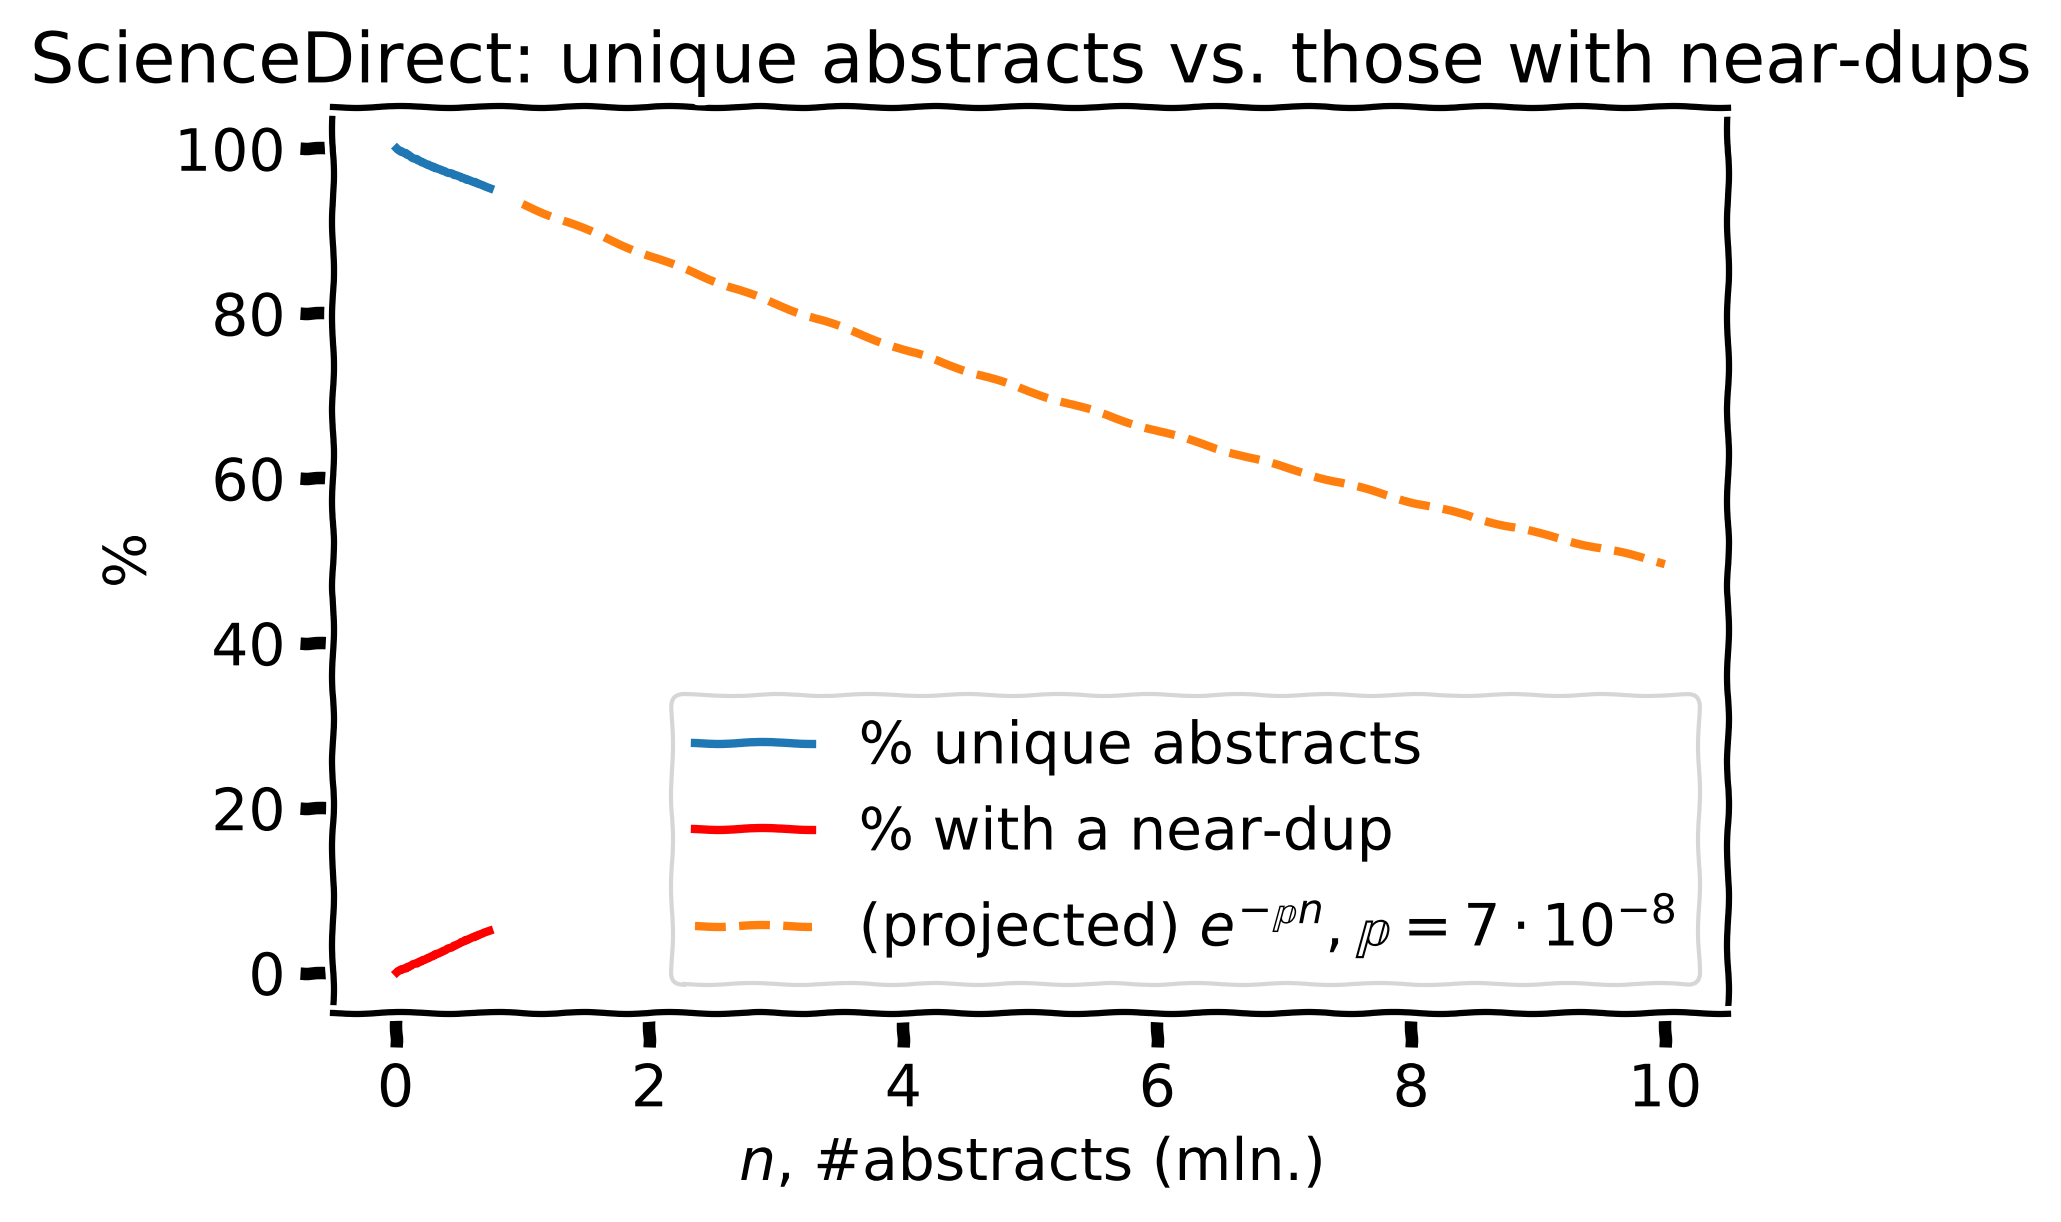
Same as before but with the projection to a set of 10 mln. abstracts (orange)
Based on the estimated \(\large \mathbb{p} = 7 \cdot 10^{-8}\), the projection to 10 mln. papers gives \(\approx\) 50% near-dups (crazy!).
4.6 mln. manuscript titles from the Editorial Manager
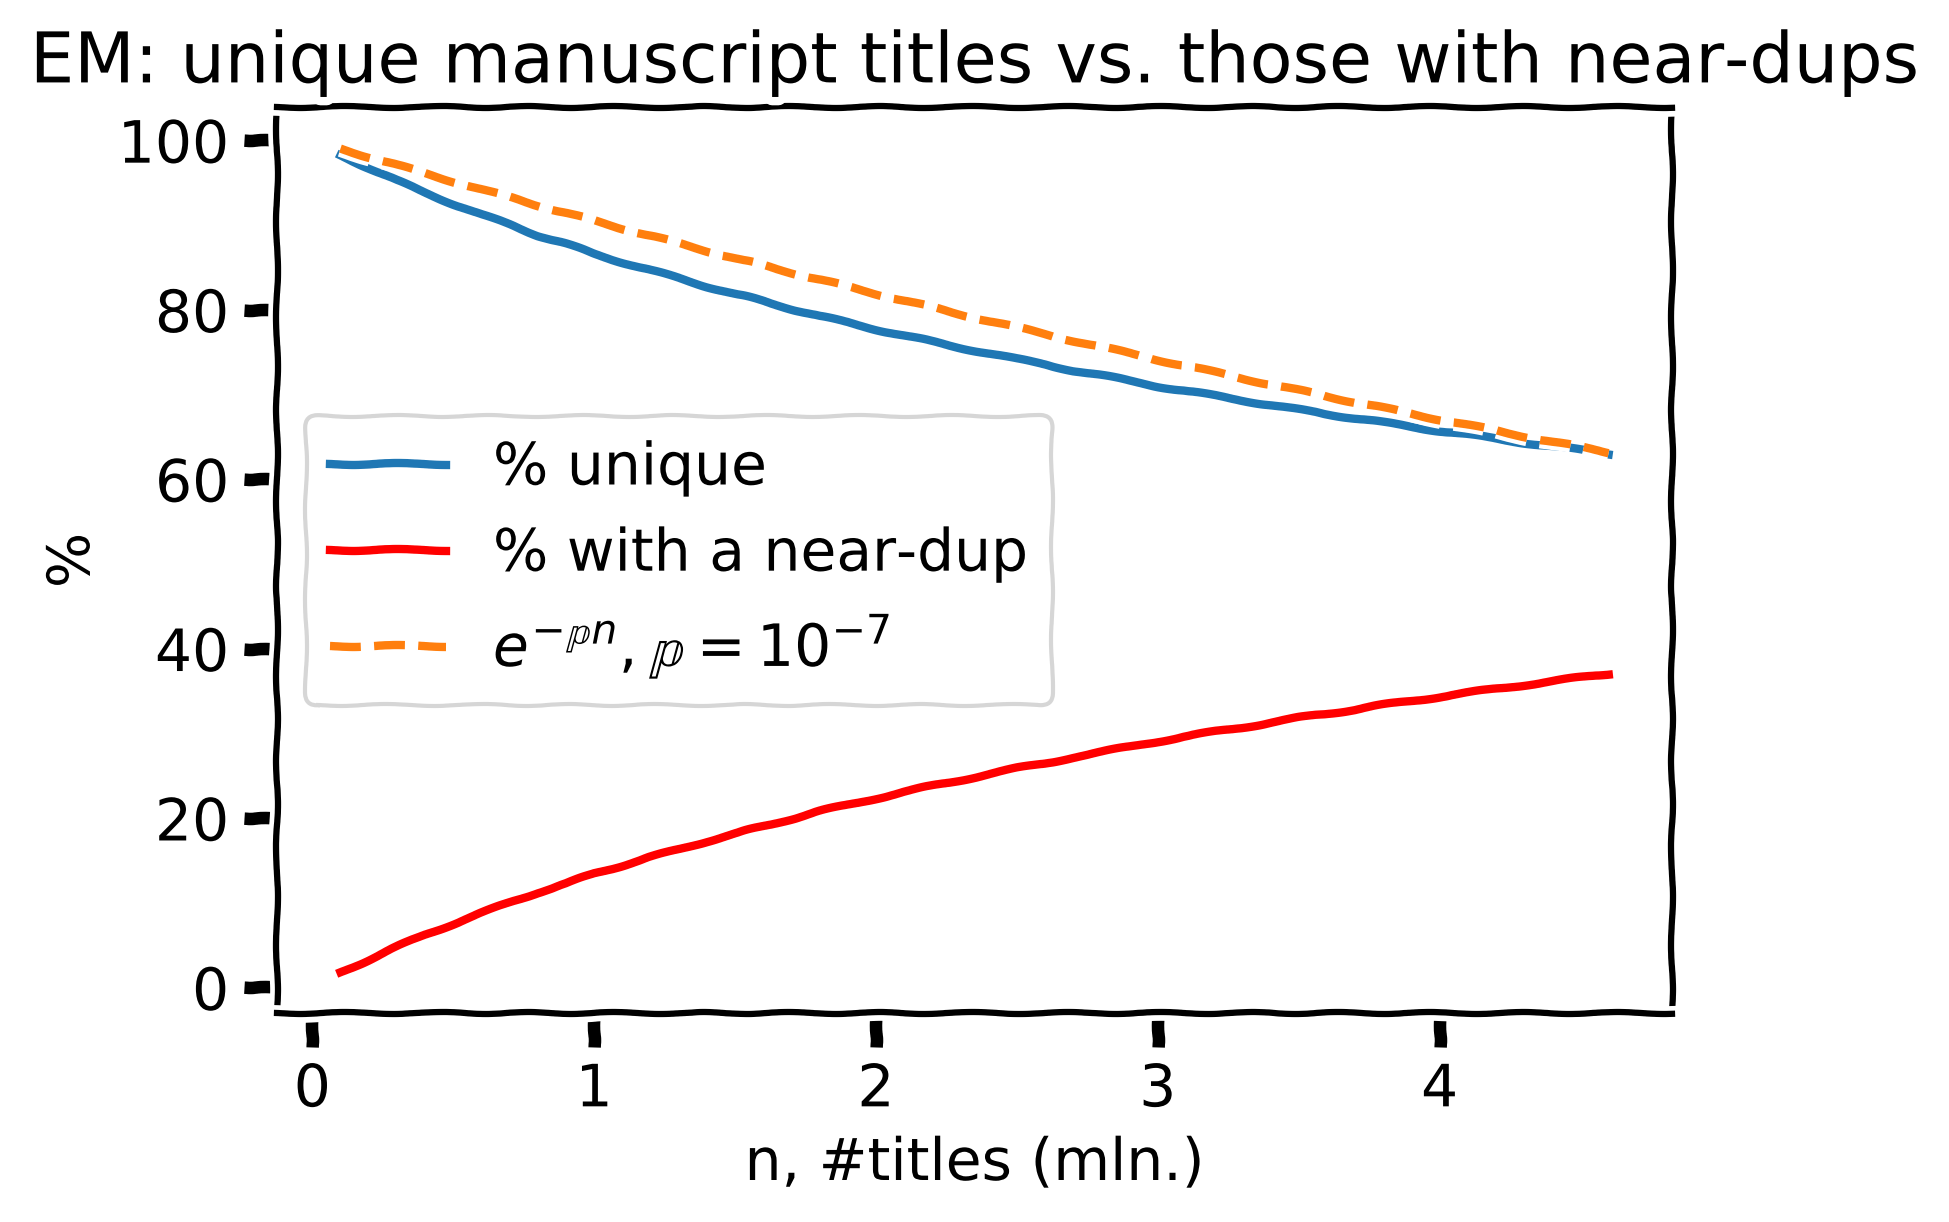
Percent of unique manuscript titles (blue) and the corresponding prediction (orange). The red line shows the share of manuscript titles with at least one near-duplicate.
For 4.6 mln. manuscripts from Editorial Manager, we see ~62.8% of unique ones, 37.2% have \(\geq1\) near-duplicate.
Estimated \(\large \mathbb{p} = 10^{-7}\). Very close! Now the previous projection doesn’t look crazy anymore.
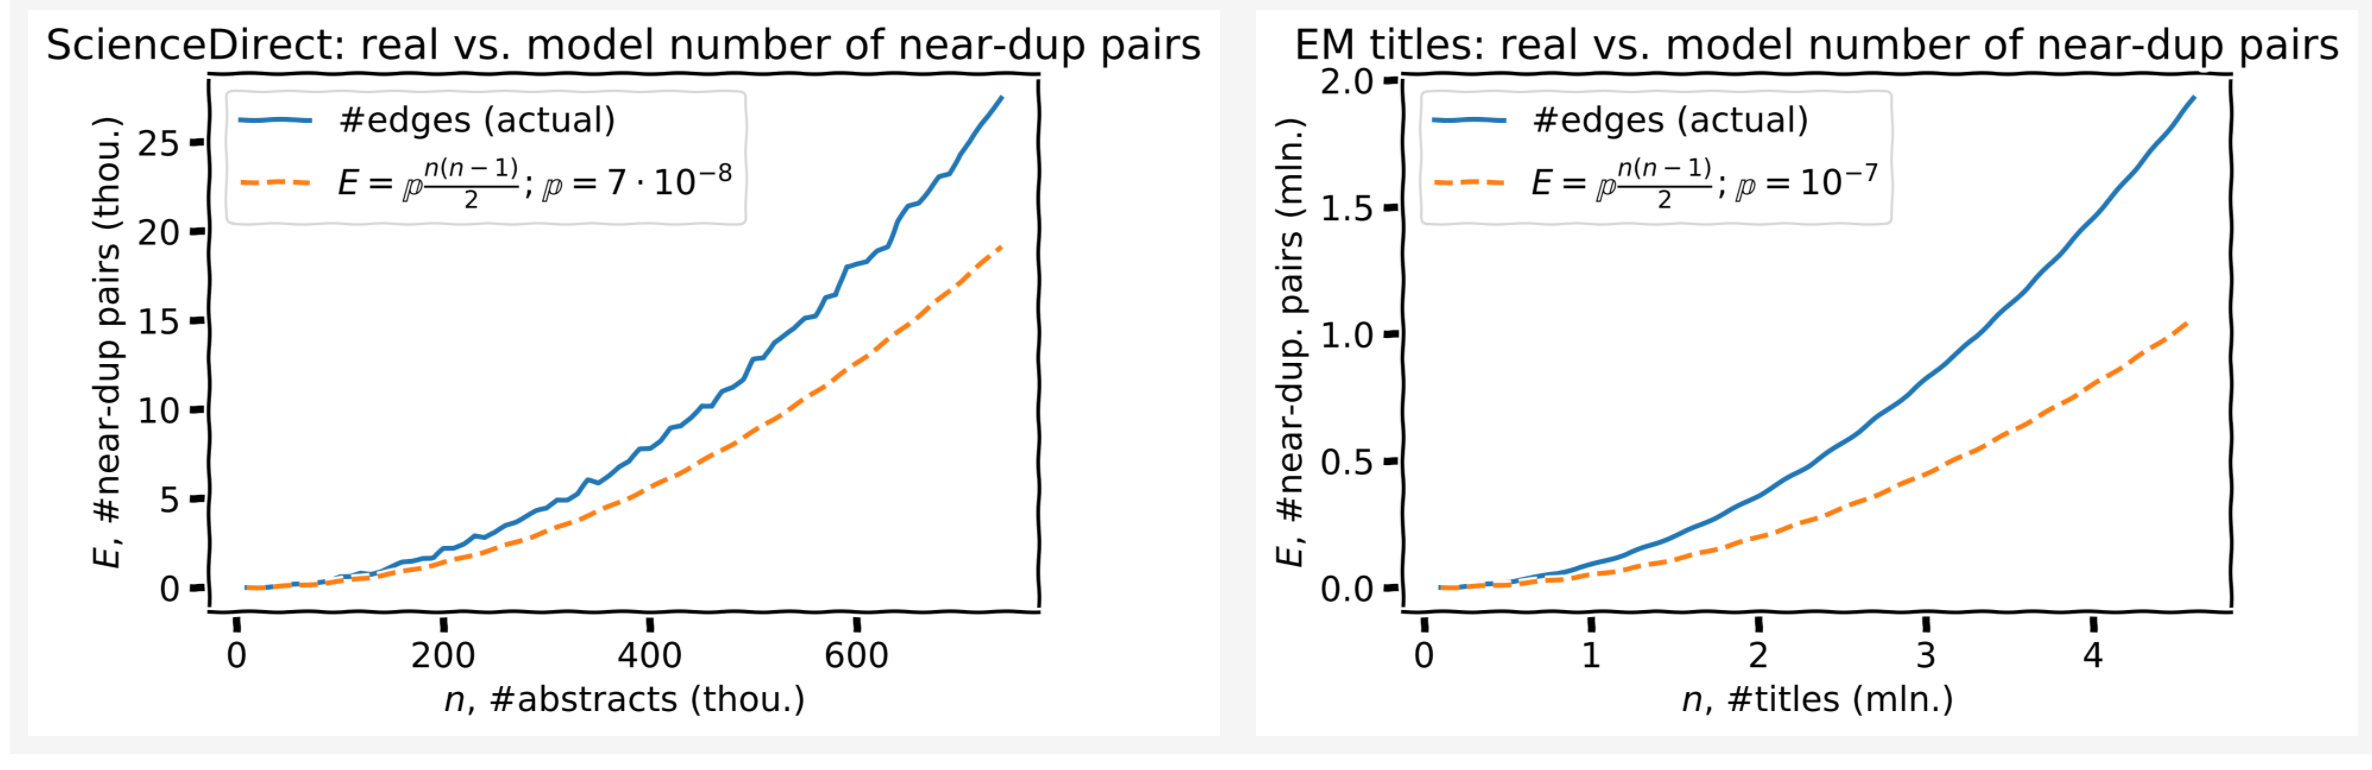
One more check of the model validity
According to the model, the number of edges is quadratic in the number of nodes:
\[E = \mathbb{p} \cdot {n \choose 2} = \mathbb{p} \cdot \frac{n(n-1)}{2}\]Imagine a clique (fully-connected graph), each edge is then kept with probability \(\mathbb{p}\), hence this formula.
The scaling law of #edges (near-dups) vs. #nodes (titles/abstracts) is predicted well, though the coefficients are a bit off. The model can be adjusted for that.
Limitations of the model/analysis
- we ran LSH with titles & abstracts, not with full texts
- LSH is probabilistic, it’s recall is <100%, i.e. it finds not all of the near-dups (the actual recall is ~90% for titles, intractable to assess for full texts)
- model predictions are good qualitatively (the model explains the effects well) but a bit off quantitatively (a discrepancy for #edges vs. #nodes)
Conclusion
The mathematical model shows that the number of papers with at least one near-duplicate increases with the size of the collection. Hence, in a combined dataset of papers from multiple publishers, we’d expect to see a higher percentage of duplicated papers and, therefore, more cases of research misconduct.